There are many ways to debug your JavaScript code. My favorite way is to use console.log() to dump variables and print program state to the debugging console.
The problem?
If you've ever created a relatively large JavaScript library or program, specifically with lots of functions, your debugging log can quickly become overwhelming. At work, I ended up creating a decent size JS library. I found that every time I had to debug a problem, I was spending most of my time parsing my own debug statements than I was fixing the problem.
My Solution: Instrumentation!
Instrumentation can mean many things, so specifically I'm referring to tracing the execution flow of your scripts through logging. Take the following JavaScript as an example:
function addRand()
{
    var r = Math.floor(Math.random()*11); // return randomly between 0 and 10
    console.log("addRand returning: ", r);
    return r;
}

function mult(a, b)
{
    var m = a * b;
    return m;
}

function doStuff()
{
    var a=2, b=5;
    console.log("Multiplying A and B");
    var m = mult(a, b);
    console.log("Adding a random number to the result");
    m += addRand();
    console.log("Result: ", m);
}

doStuff();
This code will produce the following (boring) log file:
Multiplying A and B
Adding a random number to the result
addRand returning: 2
Result: 12
Pretty sad, really. Firefox, Chrome, Safari, heck even Internet Explorer have now mostly adopted the Firebug way of debugging javascript. We can add a lot to our debugging by simply using two built-in functions, console.group() and console.groupEnd(). All they do is create (and remove) an indentation for any print statements between calls to each function. Together, they end up producing a very readable log. Here's the code with my Instrumentation added:
function _Instrument(info)
{
    console.group(
        info.name + " variables: ", (info.variables ? info.variables : "(void)")
    );
}

function _InstrumentEnd(info)
{
    console.log("Returning: ", (info && info.return ? info.return : "(void)"));
    console.groupEnd();
}

function addRand()
{
    _Instrument({name:"addRand"})
    var r = Math.floor(Math.random()*11); // return randomly between 0 and 10
    _InstrumentEnd({return: {randomNum: r}});
    return r;
}

function mult(a, b)
{
    _Instrument({name:"mult", variables: {a:a, b:b}});
    var m = a * b;
   _InstrumentEnd({return: {m: m}});
    return m;
}

function doStuff()
{
    _Instrument({name: "doStuff"});
    var a=2, b=5;
    console.log("Multiplying A and B");
    var m = mult(a, b);
    console.log("Adding a random number to the result");
    m += addRand();
    console.log("Result: ", m);
    _InstrumentEnd();
}

doStuff();
Sure, it may add a couple lines of code to each function, but it results in a log file with much more information. Put this into an environment with thousands of lines of debug information, and it becomes significantly more readable, and faster to parse.
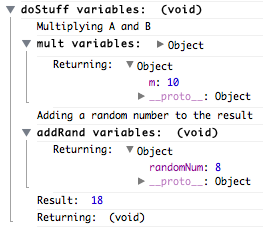
By printing to your log when you enter and exit each function, you can quickly pinpoint which function is responsible for errors. This method also helps you trace the execution path of your scripts, which can help reduce your time spent on debugging. This has reduced my debugging time, and made it a lot less annoying to parse my logs, double win!
If you're interested in what other functions you may be able to use to enhance your debugging logs, check out Firebug's Logging API, as most of these functions are built-in to Firefox and Chrome.
If you're interested in what other functions you may be able to use to enhance your debugging logs, check out Firebug's Logging API, as most of these functions are built-in to Firefox and Chrome.